Digital SAT Math: 8 Practice Questions and Desmos Methods
Use Desmos when a graph or calculation makes the problem clearer; use hand methods when the structure is already simple. The eight original SAT Math practice questions below check that choice, as well as the answer. Each worked solution explains the setup, a useful check and a common mistake.
This mini-diagnostic is for learning, not predicting an SAT score. Eight questions cannot reproduce the adaptive test or establish overall readiness. Keep the working so your next practice session targets the first step that went wrong.
Key takeaways
- Decide what the question asks before entering anything into a calculator.
- Distinguish an x-intercept from an intersection and an x-coordinate from a y-coordinate.
- Review errors by cause, then use official adaptive practice to assess pacing and performance more broadly.
Know the current digital SAT Math format
The SAT Math section has 44 questions over 70 minutes, divided into two 35-minute modules. Performance in the first module affects the difficulty of the second. Its four content areas are Algebra, Advanced Math, Problem-Solving and Data Analysis, and Geometry and Trigonometry. See College Board’s test structure and Math overview for the current format.
Bluebook includes Desmos scientific and graphing calculator options. You can also bring a permitted handheld calculator. College Board’s current calculator policy prohibits CAS functionality; check the full rules for your device before test day. Practise with the calculator you will actually use.
When should you use Desmos?
| Task | Useful starting approach | Check before answering |
|---|---|---|
| Short linear equation or obvious factors | Write a few algebra steps | Substitute the result into the original equation |
| Unequal group means or long arithmetic | Set up the model, then calculate | Use correct weights, units and brackets |
| Find where two expressions are equal | Graph both and inspect intersections | Find every relevant intersection and select the requested coordinate |
| Interpret a coefficient or percentage multiplier | Explain the number in context | A graph cannot decide what the number means for you |
How to use this mini-diagnostic
- Read each question and choose a method before calculating: hand calculation, calculator arithmetic or graphing.
- Write the setup and answer. If you use a graph, record what the axes and any intersection represent.
- Check the worked solution and label the error, if any: concept, setup, arithmetic, calculator entry or interpretation.
- Retry a missed question later with changed numbers. Do not convert your total into an SAT score.
The examples below are deliberately short. They sample skills across the four areas but do not represent the SAT’s distribution of difficulty or question types.
Eight original questions
- Solve 5x − 7 = 3x + 9.
- A hire service charges a total of C dollars for n hours, where C = 12 + 4n. How much does one additional hour add to the total?
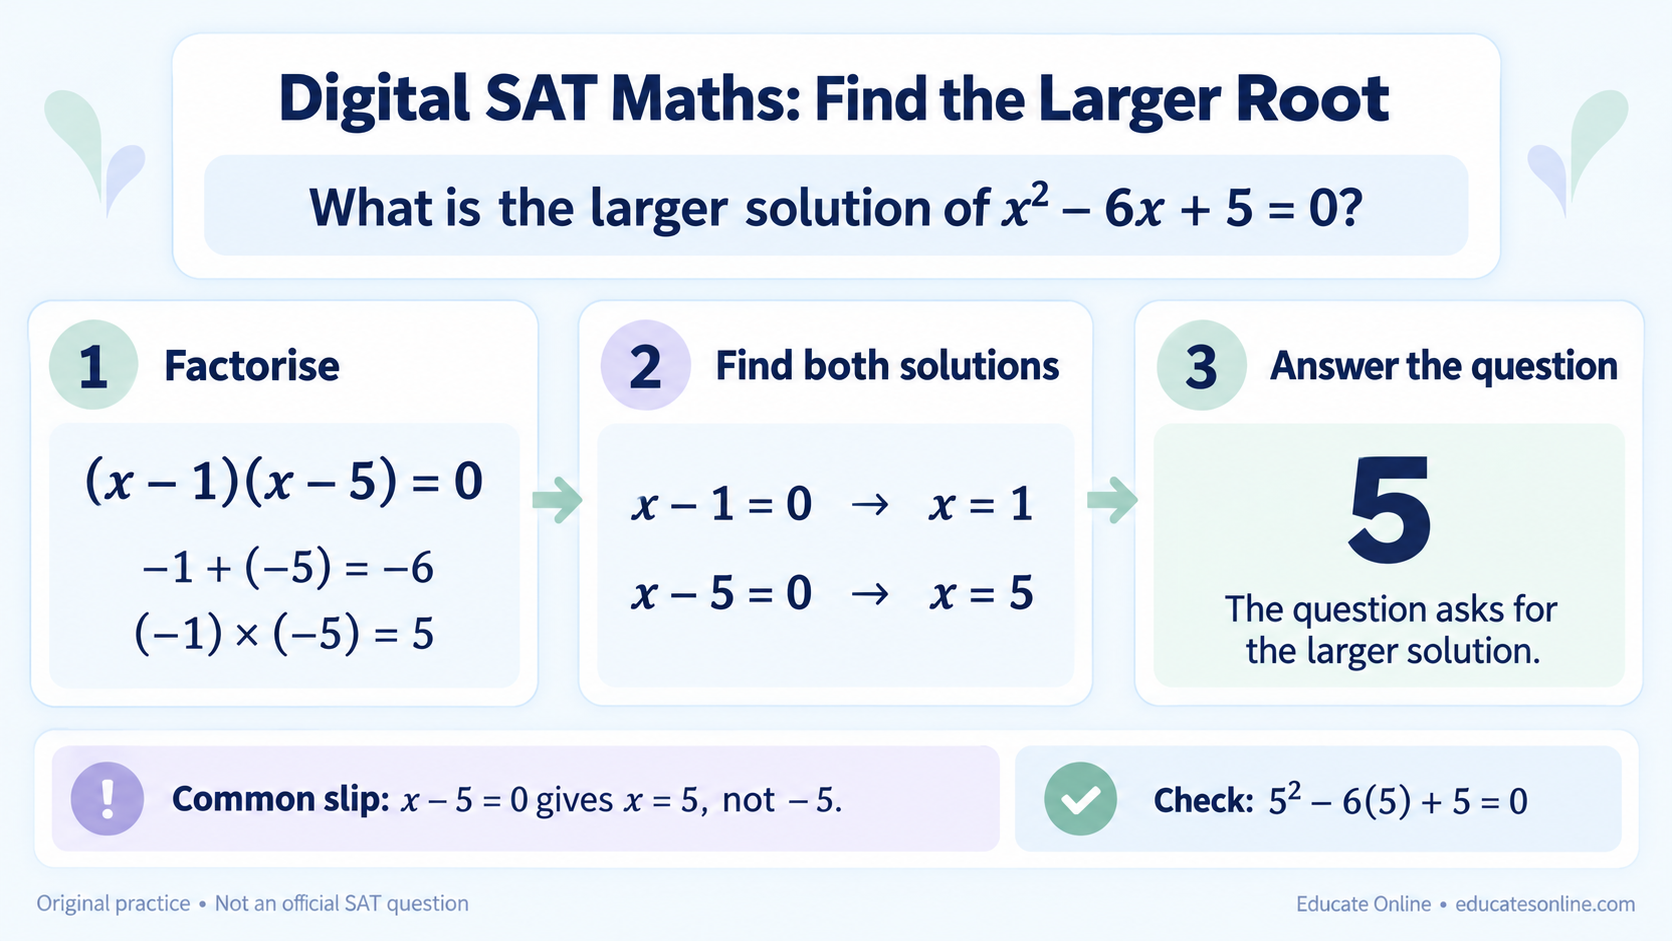
- What is the larger solution of x2 − 6x + 5 = 0?
- A model gives A = 240(1.15)t, where t is a whole number of years. What percentage increase does the model represent each year?
- Ten students have a mean score of 72 and another fifteen have a mean score of 84 on the same assessment. What is the mean score for all twenty-five students?
- A right triangle has perpendicular sides of lengths 6 and 8. What is its area?
- A circle has equation (x − 3)2 + (y + 2)2 = 25. Find its centre and radius.
- The graphs y = x2 and y = 2x + 3 intersect. What is the greater x-coordinate of an intersection?
Worked solutions and method choices
1. Solve a linear equation by hand
Subtract 3x from both sides: 2x − 7 = 9. Add 7 and divide by 2 to get x = 8. Substitution gives 33 on both sides. For a short equation like this, a few written steps may be simpler than entering two graphs.
2. Interpret the coefficient
The coefficient of n is 4, so each additional hour adds $4. The 12 is the starting charge. As a check, C is 20 for two hours and 24 for three hours. A calculator is unlikely to help if the difficulty is deciding which number describes the rate.
3. Factorise a quadratic
x2 − 6x + 5 = (x − 1)(x − 5). The solutions are 1 and 5, so the requested larger solution is 5. A graph of y = x2 − 6x + 5 would show two x-intercepts, but factorising is compact here. Notice that the question asks for one of the solutions.
4. Read an exponential growth factor
The multiplier 1.15 equals 1 + 0.15, so the increase is 15% per year. It is not 115% growth: 115% of the previous amount includes the original 100%. The value 240 is the starting amount when t = 0.
5. Combine totals before finding the mean
The first group’s total is 10 × 72 = 720, and the second’s is 15 × 84 = 1,260. The combined mean is (720 + 1,260)/25 = 79.2. Calculator arithmetic is useful after this setup. Simply averaging 72 and 84 gives 78 and incorrectly treats the unequal groups as equal-sized.
6. Identify the right measurement
The perpendicular sides are a base and its height, so area = 1/2 × 6 × 8 = 24 square units. There is no need to calculate the hypotenuse. If you found 10, you calculated a length rather than the requested area.
7. Read the centre and radius
Compare the equation with (x − h)2 + (y − k)2 = r2. The centre is (3, −2), and the radius is 5. The positive sign inside y + 2 means k = −2. Also, 25 is the squared radius, not the radius.
8. Compare algebra with a Desmos graph
Algebraically, set x2 = 2x + 3. Rearrange and factorise: x2 − 2x − 3 = (x − 3)(x + 1) = 0. The greater x-coordinate is 3.
For a graphing approach, enter y = x2 and y = 2x + 3 as separate expressions. Adjust the window if necessary and inspect both intersections: (−1, 1) and (3, 9). The question asks for x, so enter 3, not 9. Confirm by substituting x = 3 into both equations. This check protects against selecting the wrong coordinate or overlooking an intersection outside the visible window.
Three calculator checks that prevent avoidable errors
- Read the expression back. Enter an entire numerator and denominator with brackets where needed. Compare the displayed expression with the one you intended.
- Inspect the graph window. An empty visible region does not prove that there is no solution. Reconsider the scale and where the relevant values might lie.
- Answer the actual question. The larger root in question 3 is 5. The greater x-coordinate in question 8 is 3, even though the point’s y-coordinate is 9.
Practise these steps in Bluebook as well as on a familiar device. The point is to make the method reliable before adding time pressure.
Turn a wrong answer into the next practice task
Use four columns in your notes: question, first wrong step, correction, fresh attempt. For example, an answer of 78 on question 5 suggests that the two group means were averaged without their group sizes. The next task is a weighted-mean problem, not a lesson on every SAT topic.
Fresh check: six students have mean 60 and four have mean 85. The combined mean is (6 × 60 + 4 × 85)/10 = 70. Explain why a simple average of 60 and 85 would be wrong before checking with a calculator.
Choose two missed skills for your next sessions. After focused practice, take an official Bluebook practice test and review its explanations. Use the College Board Student Question Bank for further skill practice. The full Bluebook practice experience is a better way to assess pacing and performance than an eight-question checklist.
Explore SAT tutoring support or SAT Math tutoring. To discuss help with particular gaps, request a free trial and describe the topics or question types you find difficult. Trial arrangements require confirmation.
Official format and calculator references checked 16 October 2026. These questions are original Educate Online learning material, not College Board questions. No official endorsement or score prediction is implied.
Frequently asked questions
Should I use Desmos on every SAT Math question?
No. It can be useful for equations, graphs and arithmetic, but a short hand calculation or recognising a coefficient may be simpler. Choose a method you can carry out accurately and check.
What is the difference between a root and an intersection?
A root of f(x) = 0 is an x-value where the graph y = f(x) reaches the x-axis. An intersection of two graphs is a point where their y-values are equal. Check which coordinate or value the question requests.
Can these eight questions predict my SAT Math score?
No. They are original learning prompts and do not reproduce the test’s content coverage, difficulty distribution or adaptive structure. Use official full-length Bluebook practice for a broader assessment.
Are CAS calculators permitted on the SAT?
College Board’s calculator policy checked on 16 October 2026 prohibits CAS functionality. Bluebook includes Desmos scientific and graphing options. Recheck the official rules for your device and test date.
Sources
External references for the topics covered in this guide.
- SAT structure (opens in a new tab)College Board · satsuite.collegeboard.org
- SAT Math overview (opens in a new tab)College Board · satsuite.collegeboard.org
- SAT Suite calculator policy (opens in a new tab)College Board · satsuite.collegeboard.org
- Official Bluebook practice tests (opens in a new tab)College Board · satsuite.collegeboard.org
- How to Use the Student Question Bank (opens in a new tab)College Board · satsuite.collegeboard.org